By Adrian | December 18, 2019
In my last post I wrote about Installing and Securing NodeRED. The reason behind this was twofold. First, NodeRED is pretty cool and I want to be able to do some more ETL (Extract, Transform, Load) operations for personal projects I want to start on and secondly, I’ve been looking into TheHive webhooks functionality and needed some way to drive it in a way that didn’t require hundreds of lines of bespoke python code. NodeRED seems like it will be an ideal platform and the learning curve isn’t too steep.
Webhooks were introduced into TheHive way back in version 2.13 (September 2017) and it really does give you the ability to extend the functionality way past what is baked into the product, Its like the developers knew that they would not be able to please everybody’s unique use cases they had in mind with the various technology stacks they might be using and gave us a way to extend the functionality to our own circumstances. The sample code on my github contains the webhook paths i’ve discovered to date along with some sample code to execute an analyzer or send an email when a particular alert occurs such as when a user account is locked or modified. If there are calls ive missed, please let me know.
The NodeRed code for each path is by no means complete and this is intentional, the 2 use cases I’ve added in the sample would be the most common things you may want to do. You may also wish to perform other actions with the flow of data coming from TheHive such as:
- writing it out to a log/audit file, S3 bucket
- send something across to your SIEM
- when an indicator is added, search for it across your SIEM
- notify a chat app that supports incoming webhooks such as
Slackthat a particular person has grabbed a case - Send the data over to a custom dashboarding app
- Create a pager/SMS type alert
- Send an SMS / push notification
- Make a smartbulb start flashing red or a 100db siren go off each time a high priority case is raised
While the last one would be more of an amusing prank to pull on someone, the point is the possibilities are only limited by your imagination when you are controlling the flow of data.
To get started with this project you will need a few things in your infrastructure to begin with, namely, instances of TheHive, Cortex and NodeRED that can all talk to each other on your network.
Update TheHive configuration
We need to make a modification to TheHive application.conf file to enable webhook functionality. This can be done by making adding the following change and then restarting TheHive service.
webhooks {
  myLocalwebHook {
    url="https://yournodered.example.com:1880"
  }
}
Import NodeRED flow
Then go ahead and grab a copy of the NodeRed sample flow from my github
Import the json into NodeRED by using the 3 horizontal line menu option and selecting Import. Paste in the json or point it to a file if you downloaded it. Ensure that Import to new flow is selected.
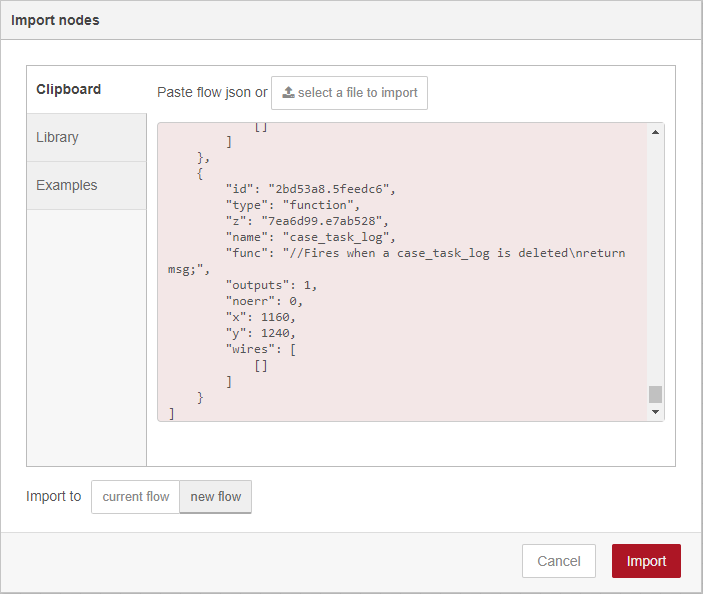
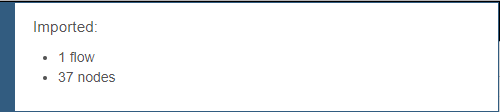
You should see a message appear detailing what you just imported.
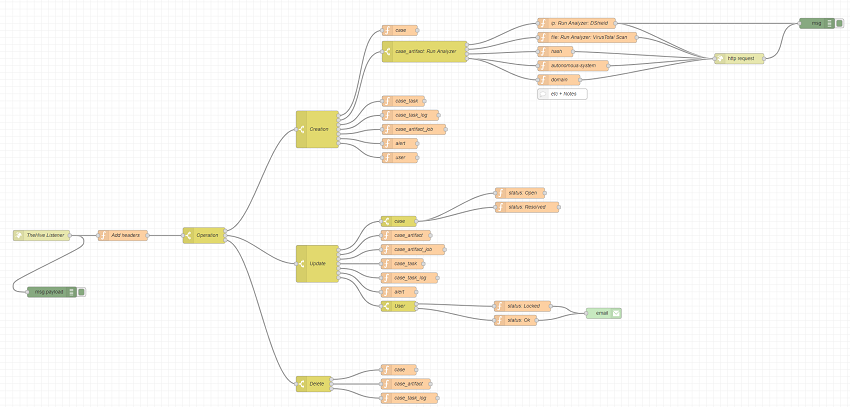
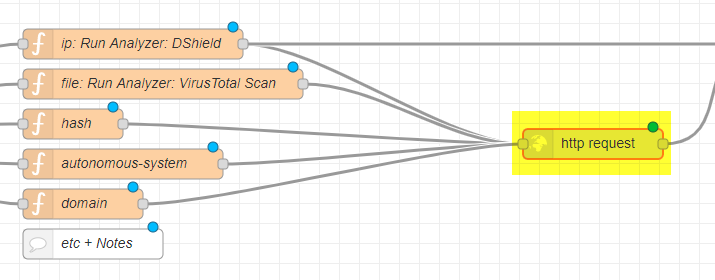
Your canvas should now look like this.
Modify required nodes for your environment
Before you can actually utilise it, there is some additional configuration that is required to suit your environment.
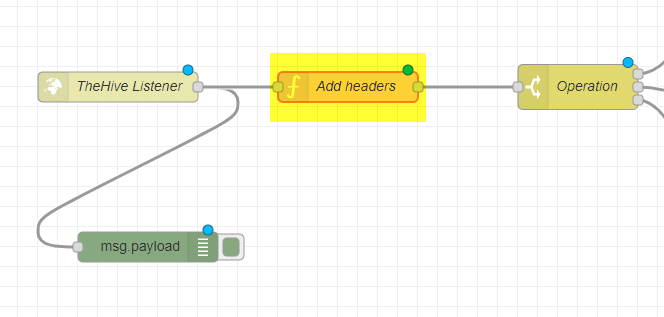
Add Headers
Double Click on the node named Add Headers and update as appropriate. The cortex_id is the property is stored in your application.conf file for TheHive.
The node will have the following existing code:
msg.thehive_url = 'https://thehive.example.com';
msg.cortex_url = 'https://cortex.example.com';
msg.cortex_id = 'CORTEX-SERVER';
return msg;
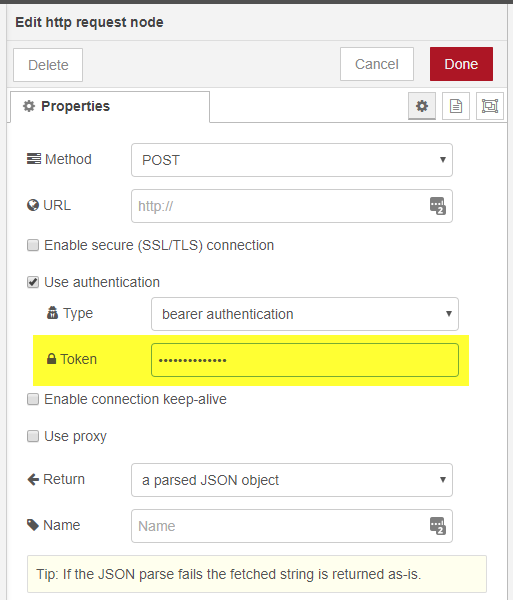
http-request
Double click on the node name http request.
Put in the API key into the Token field.
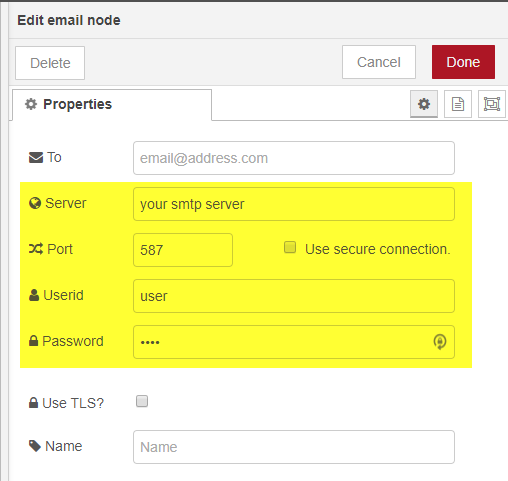
Double click on the node name email.
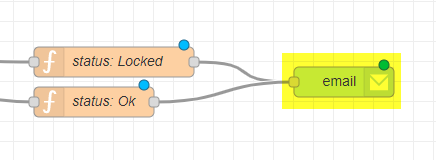
Add in your SMTP server, username and password details as appropriate.
analyzers / responders
Each analyzer/responder will contain an id that is unique to your installation. For this to work, the analyzer will need to be enabled and configured within Cortex first.
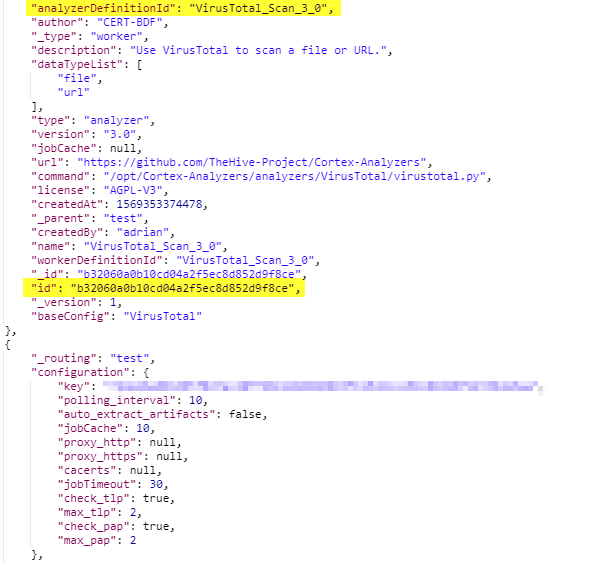
In order to configure a flow to use an analyzer for auto enrichment, you need to discover these ID’s. Fortunately this is quite easy. Either login to your Cortex UI, then change the url to https://cortex.example.com/api/analyzer or use a curl command with an Authorization Bearer: API KEY header. Your will be thrown a bunch of json. If its too hard to read, use a tool that can prettify it. You are looking for the analyzerDefinitionId and id field in the same json block. Copy the id.
In this example flow:
- when an
Observableof aniptype is added, it will be automatically run against theDShieldanalyzer. - when an
Observableof afiletype is added it will be automatically run against theVirusTotal Scananalyzer.
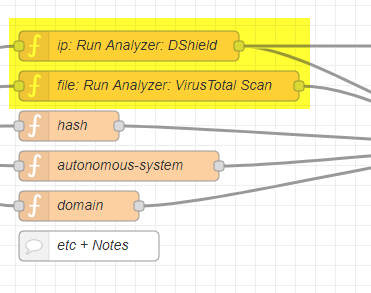
Next double-click on the function named file: Run Analyzer: VirusTotal Scan and update the msg.analyzer_id line with the id you just copied. The rest of the code is fine to leave.
I hope that by providing a few samples, you can replicate for whatever analyzer you want to run.
Deploy the flow
Activate the flow by using the Deploy button at the top right of the window.
And thats it, Whenever an action takes place in TheHive, it will be sent to the webhook and picked up by NodeRED.
Troubleshooting
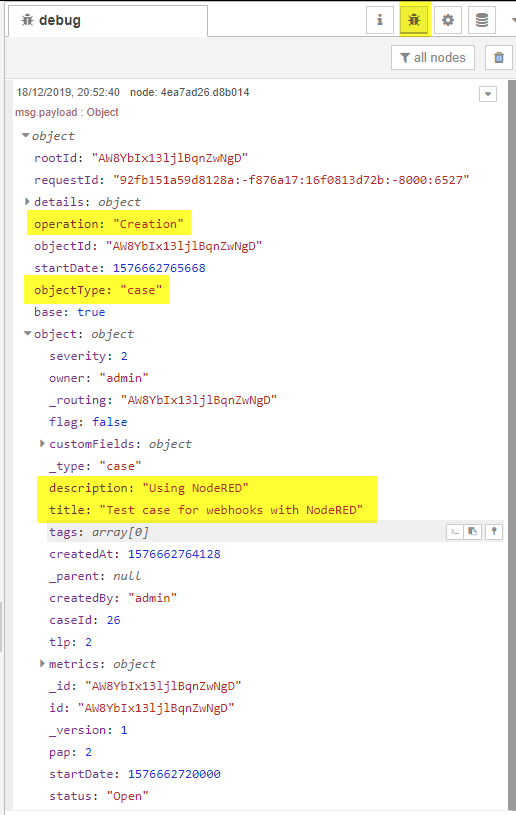
NodeRED provides a node named Debug which you can attach to a node to view the output of a node at the time when the data passes by it. I have kept one of these debug nodes attached to the initial listener. You can access this output by using the bug icon in the top right hand side of the browser. Here I have created a case in TheHive with the title of Test case for webhooks with NodeRED.
Testing it all out
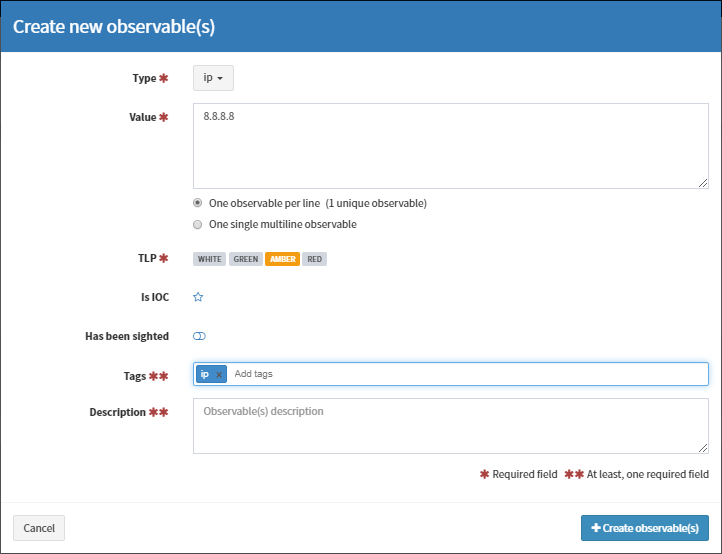
Hopefully at this point, when you perform an action in TheHive, you should see these debug messages come along, but we went to all the effort of discovering the analyzer id’s so lets test it out. Here I’ll create an ip observable for 8.8.8.8.
This is what happens under the hood after you press the Create Observable button:
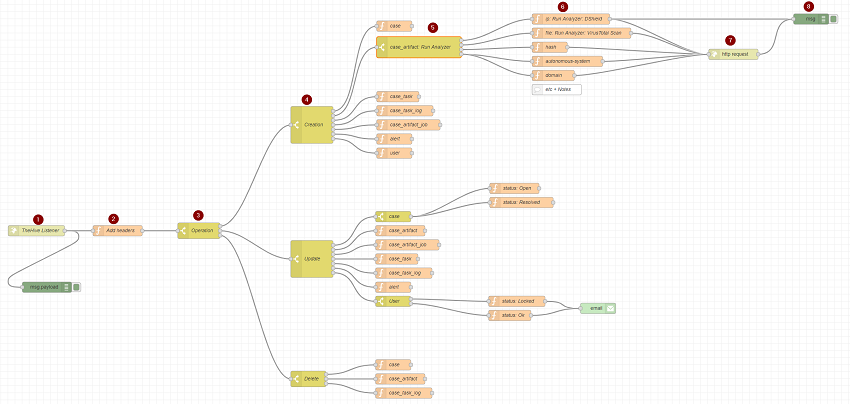
- The data is passed via TheHive webhook to the
NodeRED TheHive listener - The Cortex/TheHive details are added to the message (
Add Header) - The
payload.operationis examined and determined to be aCreationevent (Pass to Output 1) - The
payload.objectTypeis examined and determined to be acase_artifactevent (Pass to Output 2) - The
payload.object.dataTypeis examined and determined toip(Pass to Output 1) - The
ip: Run Analyzer: DShieldfunction is run which adds the appropriate TheHive API details to the message - The
http requestis executed sending the message to Cortex via TheHIVE API call - A debug message is shown
The end result can now be seen in TheHive.
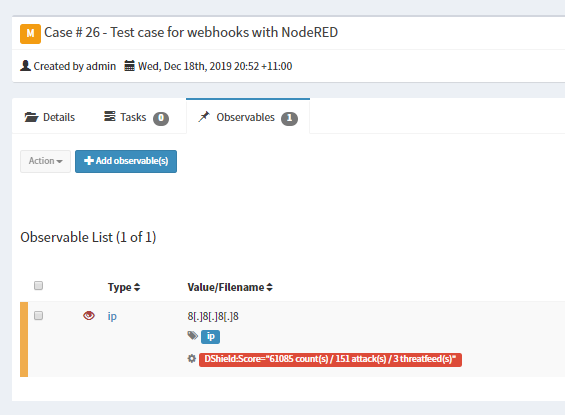
And there you have it, auto enrichment of an observable. The other use case I’ve coded in was to send an email when an account is changed.
Conclusion
TheHive webhook gives you the chance to automate and perform event based actions suitable for your own requirements, but you will need to give it your time and attention to get right and perhaps a little bit of coding in NodeJS. The best part is you are not limited to NodeRED as your orchestration platform, there are so many free and paid options available. Even if you did not go down the the path of NodeRED, the calls coming out of TheHive will be the same so the operation tree could be used to speed up a deployment of another option ever so slightly.
I hope you found this useful, don’t forget to follow me on Twitter. Thank you.