By Adrian | December 17, 2022
MITRE ATT&CK. Its the bread and butter for Security Operations Centres. But how are you tracking what you can detect? Does your SIEM have a built in tool?, Perhaps you have you straight up copied the matrix into Excel? or keeping score in a text file?
You may or may not be aware of the online version of the MITRE Navigator. Theres heaps of functionality, allowing you to apply custom colors, heat mapping to score tallies, show all the tactic/technique ID’s as well as export functionality to Excel/SVG/JSON. One of the most powerful features is the ability to import a matrix from a JSON file. A file that can quite easily coded in both Python and Powershell.
What I wanted to cover in this post was how easy it is to create a multi-layered matrix, where you individually code up several layers and then apply an aggregation mechanic to create a consolidated view. Lets begin.
Create a New Layer
Firstly open up the MITRE Navigator
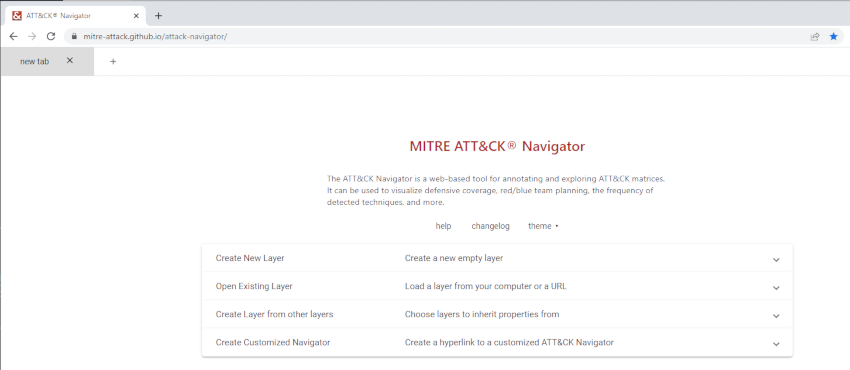
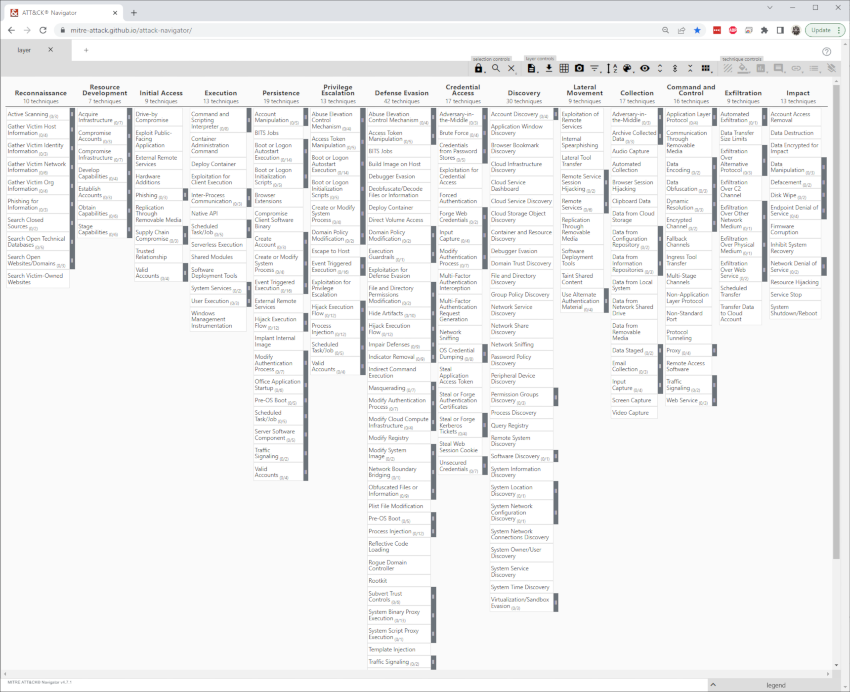
Select Create New Layer -> Enterprise
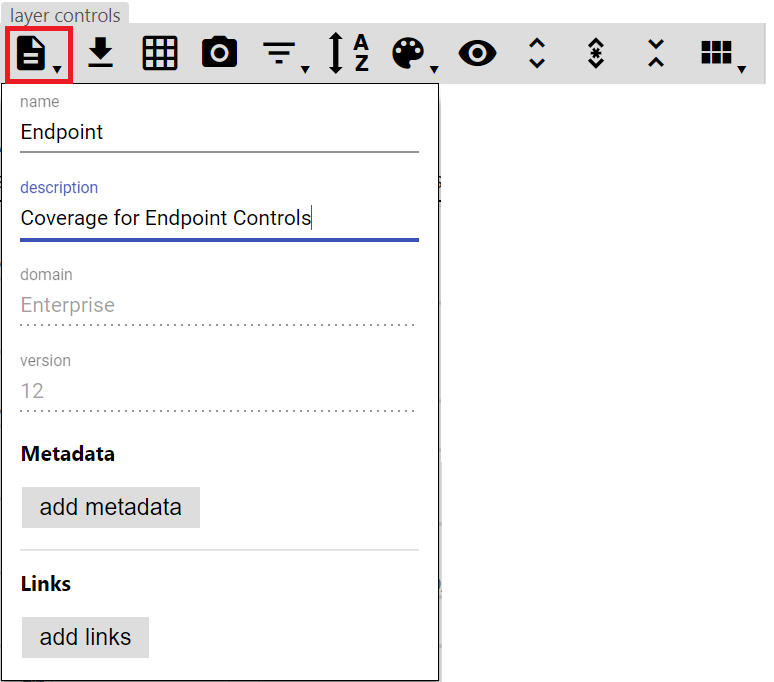
In the top toolbar select Layer Information from the Layer Controls, and name as appropriate. You can click the same button again to hide it. I have called this particular layer Endpoint
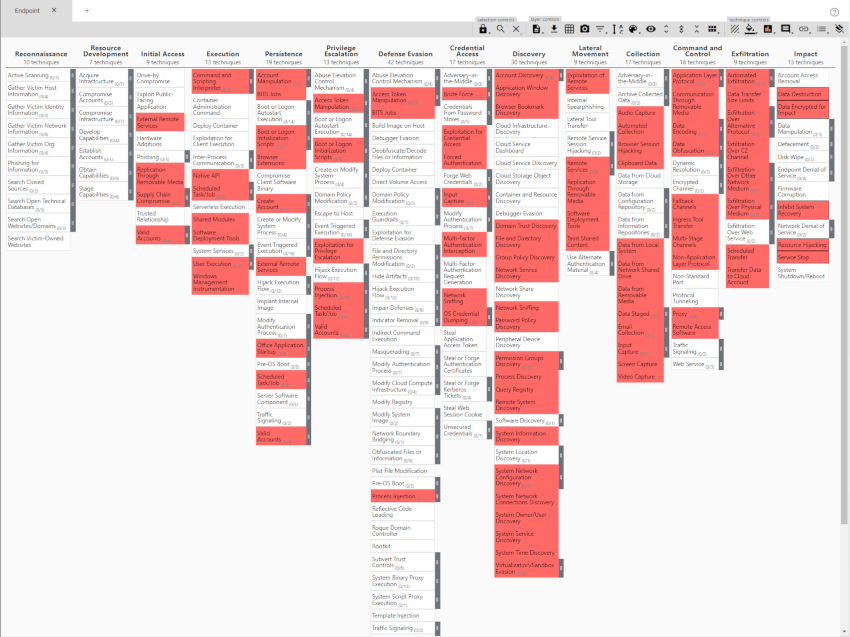
Select each technique as appropriate and then add the score modifier using the Scoring button in the toolbar. The cell colour should change. When everything is selected it may look like this one I filled in with arbitary data.
Add more layers
When you are satisfied with the first layer, press the + tab button and select Create New Layer. Follow the steps as before, and complete a new matrix for each control you are mapping out.
Create a consolidated view
With all your layers created, press the + tab button and select Create Layer from Other Layers. Ensure that the correct domain is selected (Enterprise ATT&CK v12).
One thing you will note is that each of your layers will have a varaible in yellow now, and those same variables are listed under score expression
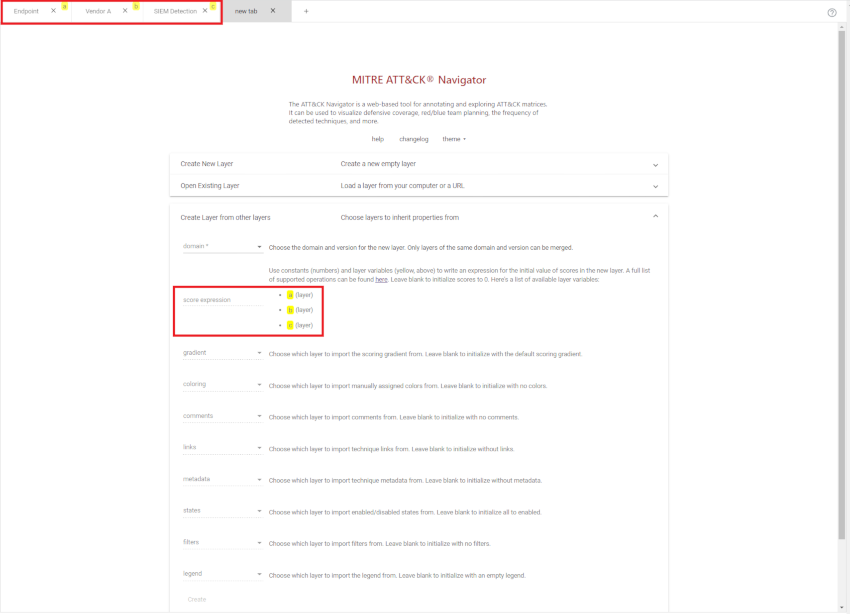
From here we can create an aggregate of the 3 layers by creating the score expression of (a + b + c)
Complete by pressing Create. Give the layer a fancier title. The colouring represents a heat map which can be configured by pressing the color setup button.
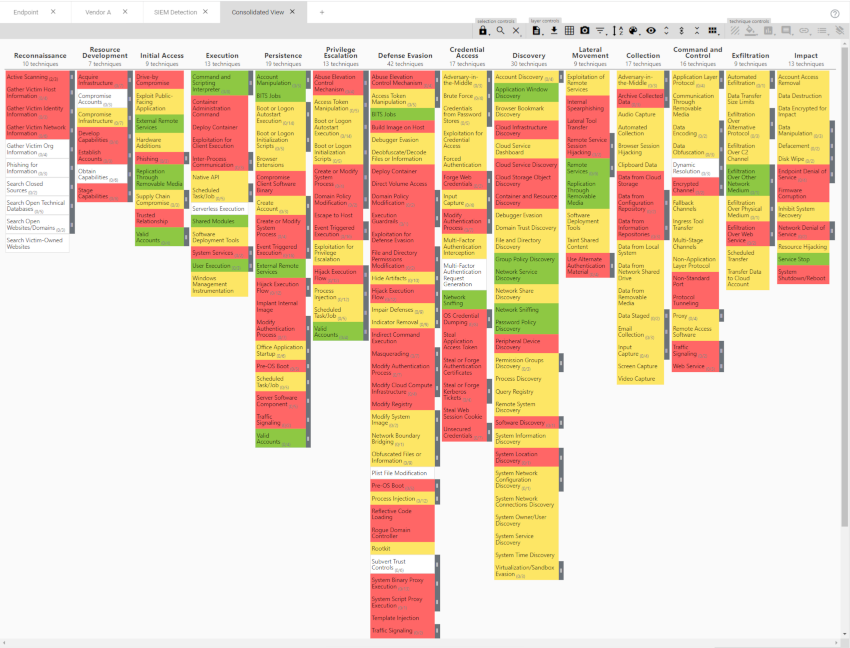
Volia, now you have a great idea of any potential gaps in your detection capability.
One important thing to note is that if you update any of the layers (by selecting a new tactic) that formed the consolidated matrix, your consolidated view will need to be recreated to reflect the change.
What other expressions are available
Given that the score expression uses mathjs standard math functions apply here. For example, you could create a view where you want to see if there is coverage in each control by using (a and b and c) as your score expression.
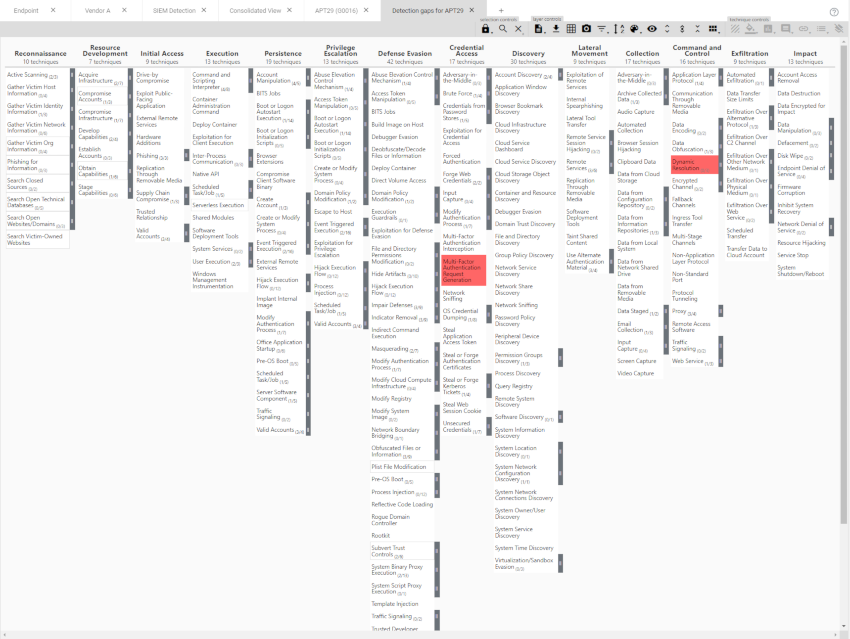
You may have downloaded a json file for a particular threat actor group off the ATT&CK website and want to evauluate your current controls against it. Just use the expression that uses group - your detection matix. You will need to tweak your cell colouring as appropriate.
You may also want to track your detections month over month to show your detection journey over time, further highlighing where your detections are a little bare.
Conclusion
I find myself refering to the MITRE Attack Matrix on a daily basis. Its an awesome source of information about so many attacker tactics and techniques, but the real power comes when you start to fully map out what you can detect to know what you cant. Although the MITRE matrix doesnt cover every possible novel way an attacker can use, its pretty damn good and is constantly evolving.
In my next post, ill go over how to stand up the Attack Navigator locally.